


Table of contents
Activity Dashboard
The Activity Dashboard gives you a day-by-day view of how work is happening across your team. It is the place to go when you want to understand what a specific day looked like, what kind of work people were doing, and how their time was distributed.
You can reach it from Activities in the top navigation, then select Dashboard.
Navigating Dates
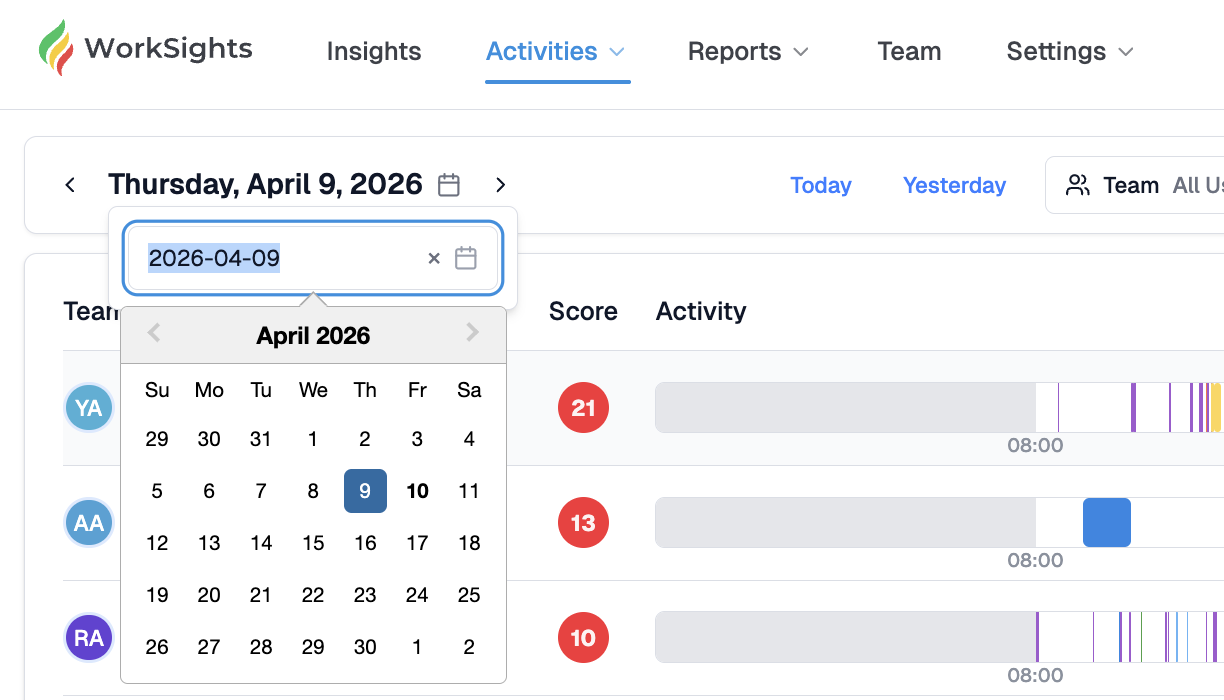
The selected date is shown in the top left. Use the arrows to move forward or backward one day at a time, or click the calendar icon to jump to a specific date. The Today and Yesterday shortcuts give you fast access to the most recent days.
ClientSights only shows data for dates that have already passed. Future dates are not available.
Filtering the View
Three filters sit at the top of the page and can be used together or independently.
- Team - defaults to All Users. Use the dropdown to narrow the view to a specific person or group. You can search by name or email.
- Categories - filters the activity timeline by activity type. Available categories include Email (Send), Files, Calendar Change, Meeting (Internal), Meeting (External), Calendar Block, Call, Email (Inbox), Chat, Login, Code, Presence, Task, and General. All are selected by default. Deselect any you want to hide and click Apply.
- Services - filters activity to show only data from specific connected services. Useful when you want to focus on one integration at a time.
Reading the Dashboard
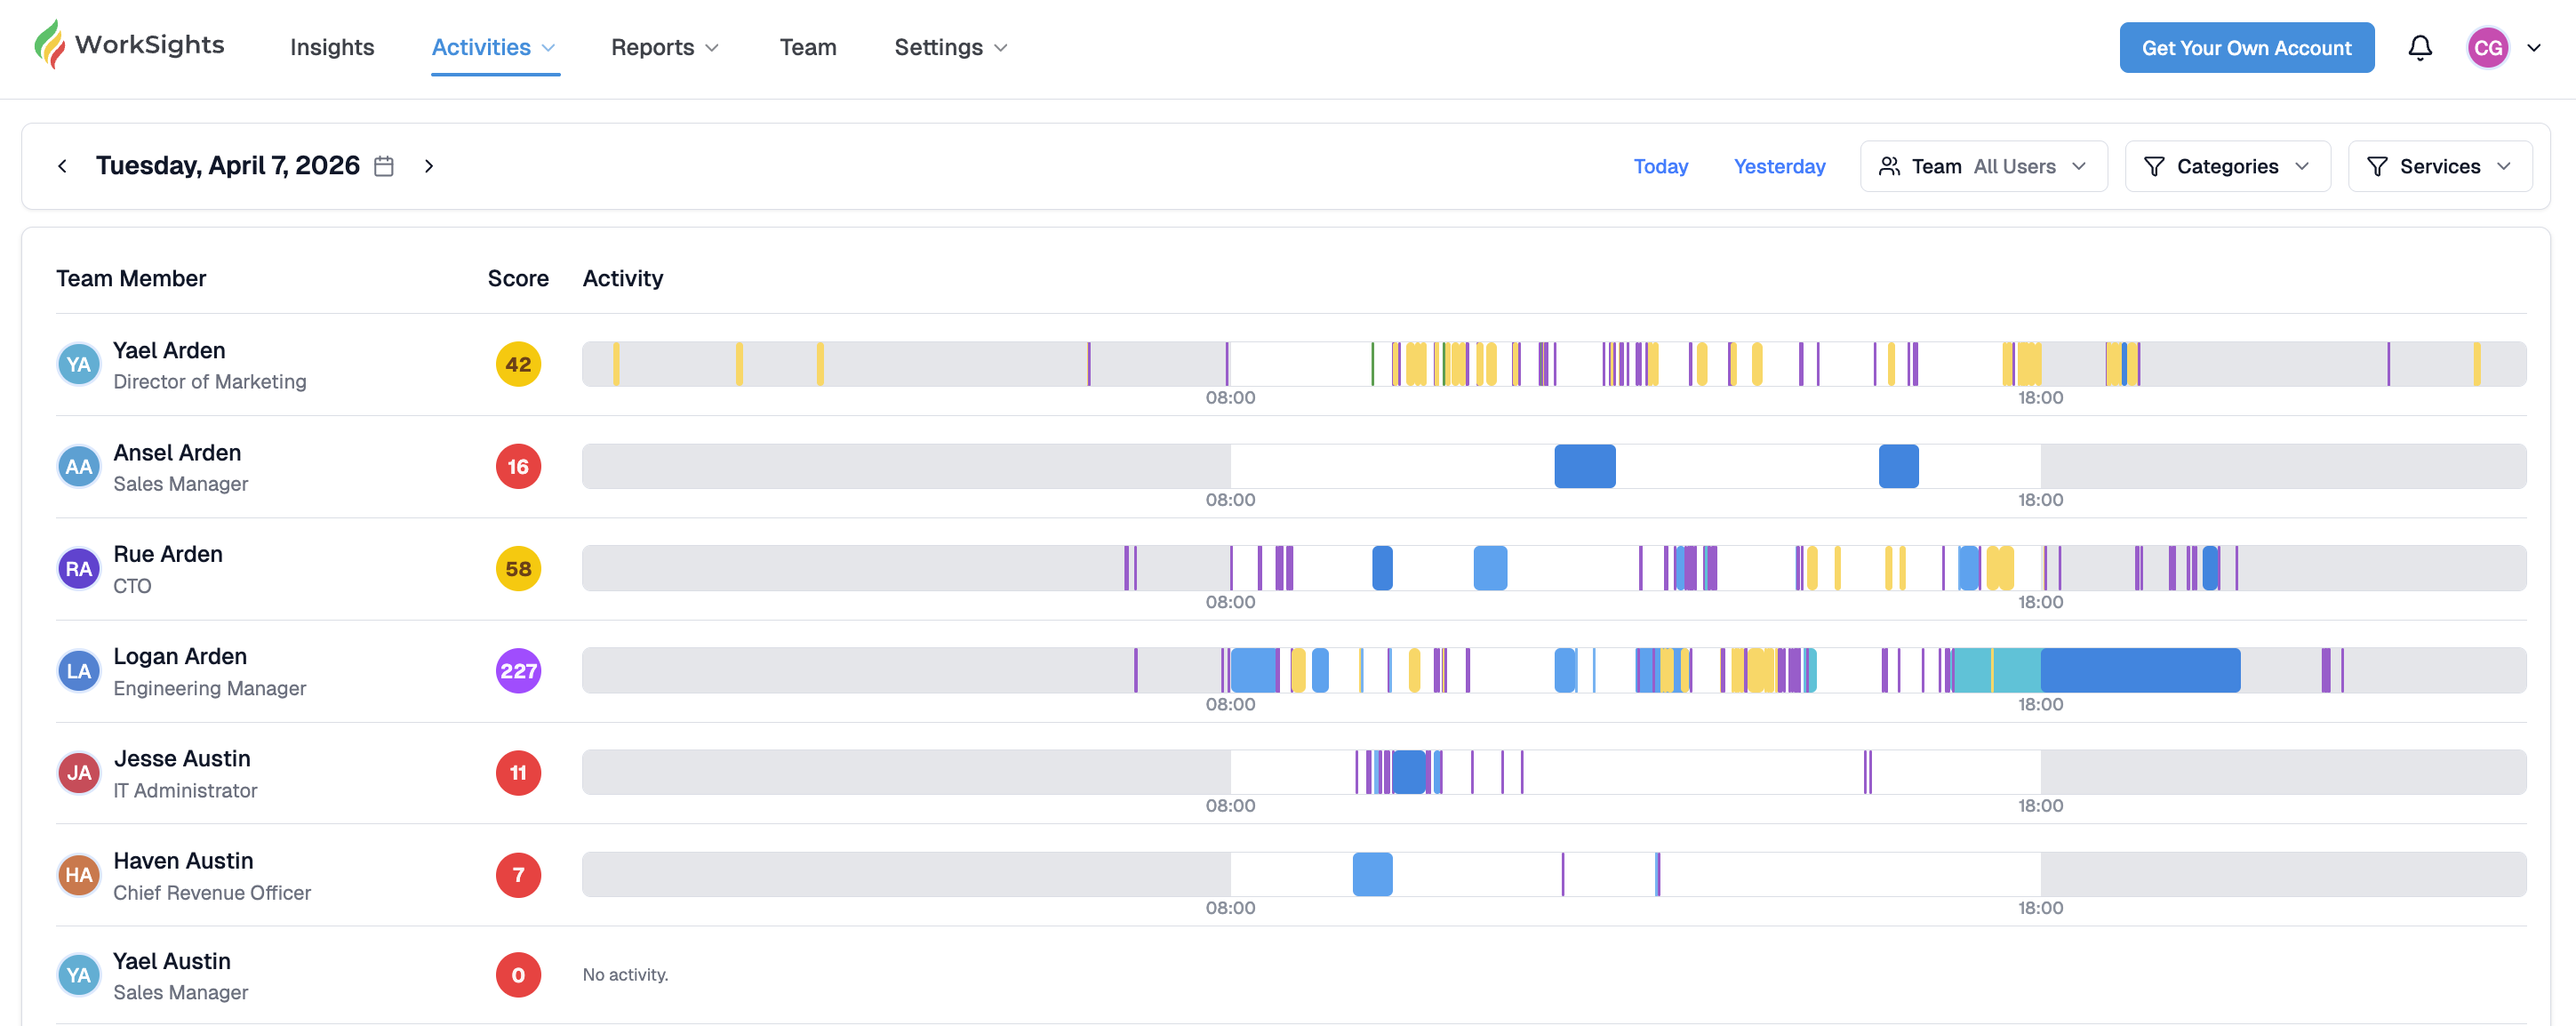
Each row represents one team member. Every row shows:
- Name and title - click the name to open the Activity Detail view for that person on the selected date.
- Activity estimate - a daily activity signal calculated relative to the person's scheduled hours and target. It updates automatically once connected services have finished sending their data, typically in the early hours of the morning. An hourglass icon means the estimate is still being calculated. A palm tree icon means the day was a recognised non-work day and no estimate applies.
- Activity bar - a colour-coded visual of the person's day from their scheduled start to end time. Each colour corresponds to an activity category. Gray areas represent non-work hours.
- No activity - if a team member has no recorded activity for the selected date, their row shows No activity. This can mean the person was not working that day, that their connected services did not send data, or that they are not yet mapped to any active integrations.

A Note on Timezones
The Activity Dashboard is timezone-aware. All activity times are shown in each user's local timezone, so you can meaningfully compare team members across different regions without manually adjusting for time differences.
Related Guides
Activity Detail - a full breakdown of one person's activity on a specific date
Scores - team performance estimates ranked and summarized for a selected day
Connected Services - checking integration status if activity looks incomplete