


Table of contents
Activity Scores
The Scores view gives leaders a day-by-day picture of how work flowed across their team. It translates activity signals from your connected tools into a single reference point for each person and for the team as a whole, helping you notice patterns, spot quiet days worth a conversation, and understand how your organisation moves through its work.
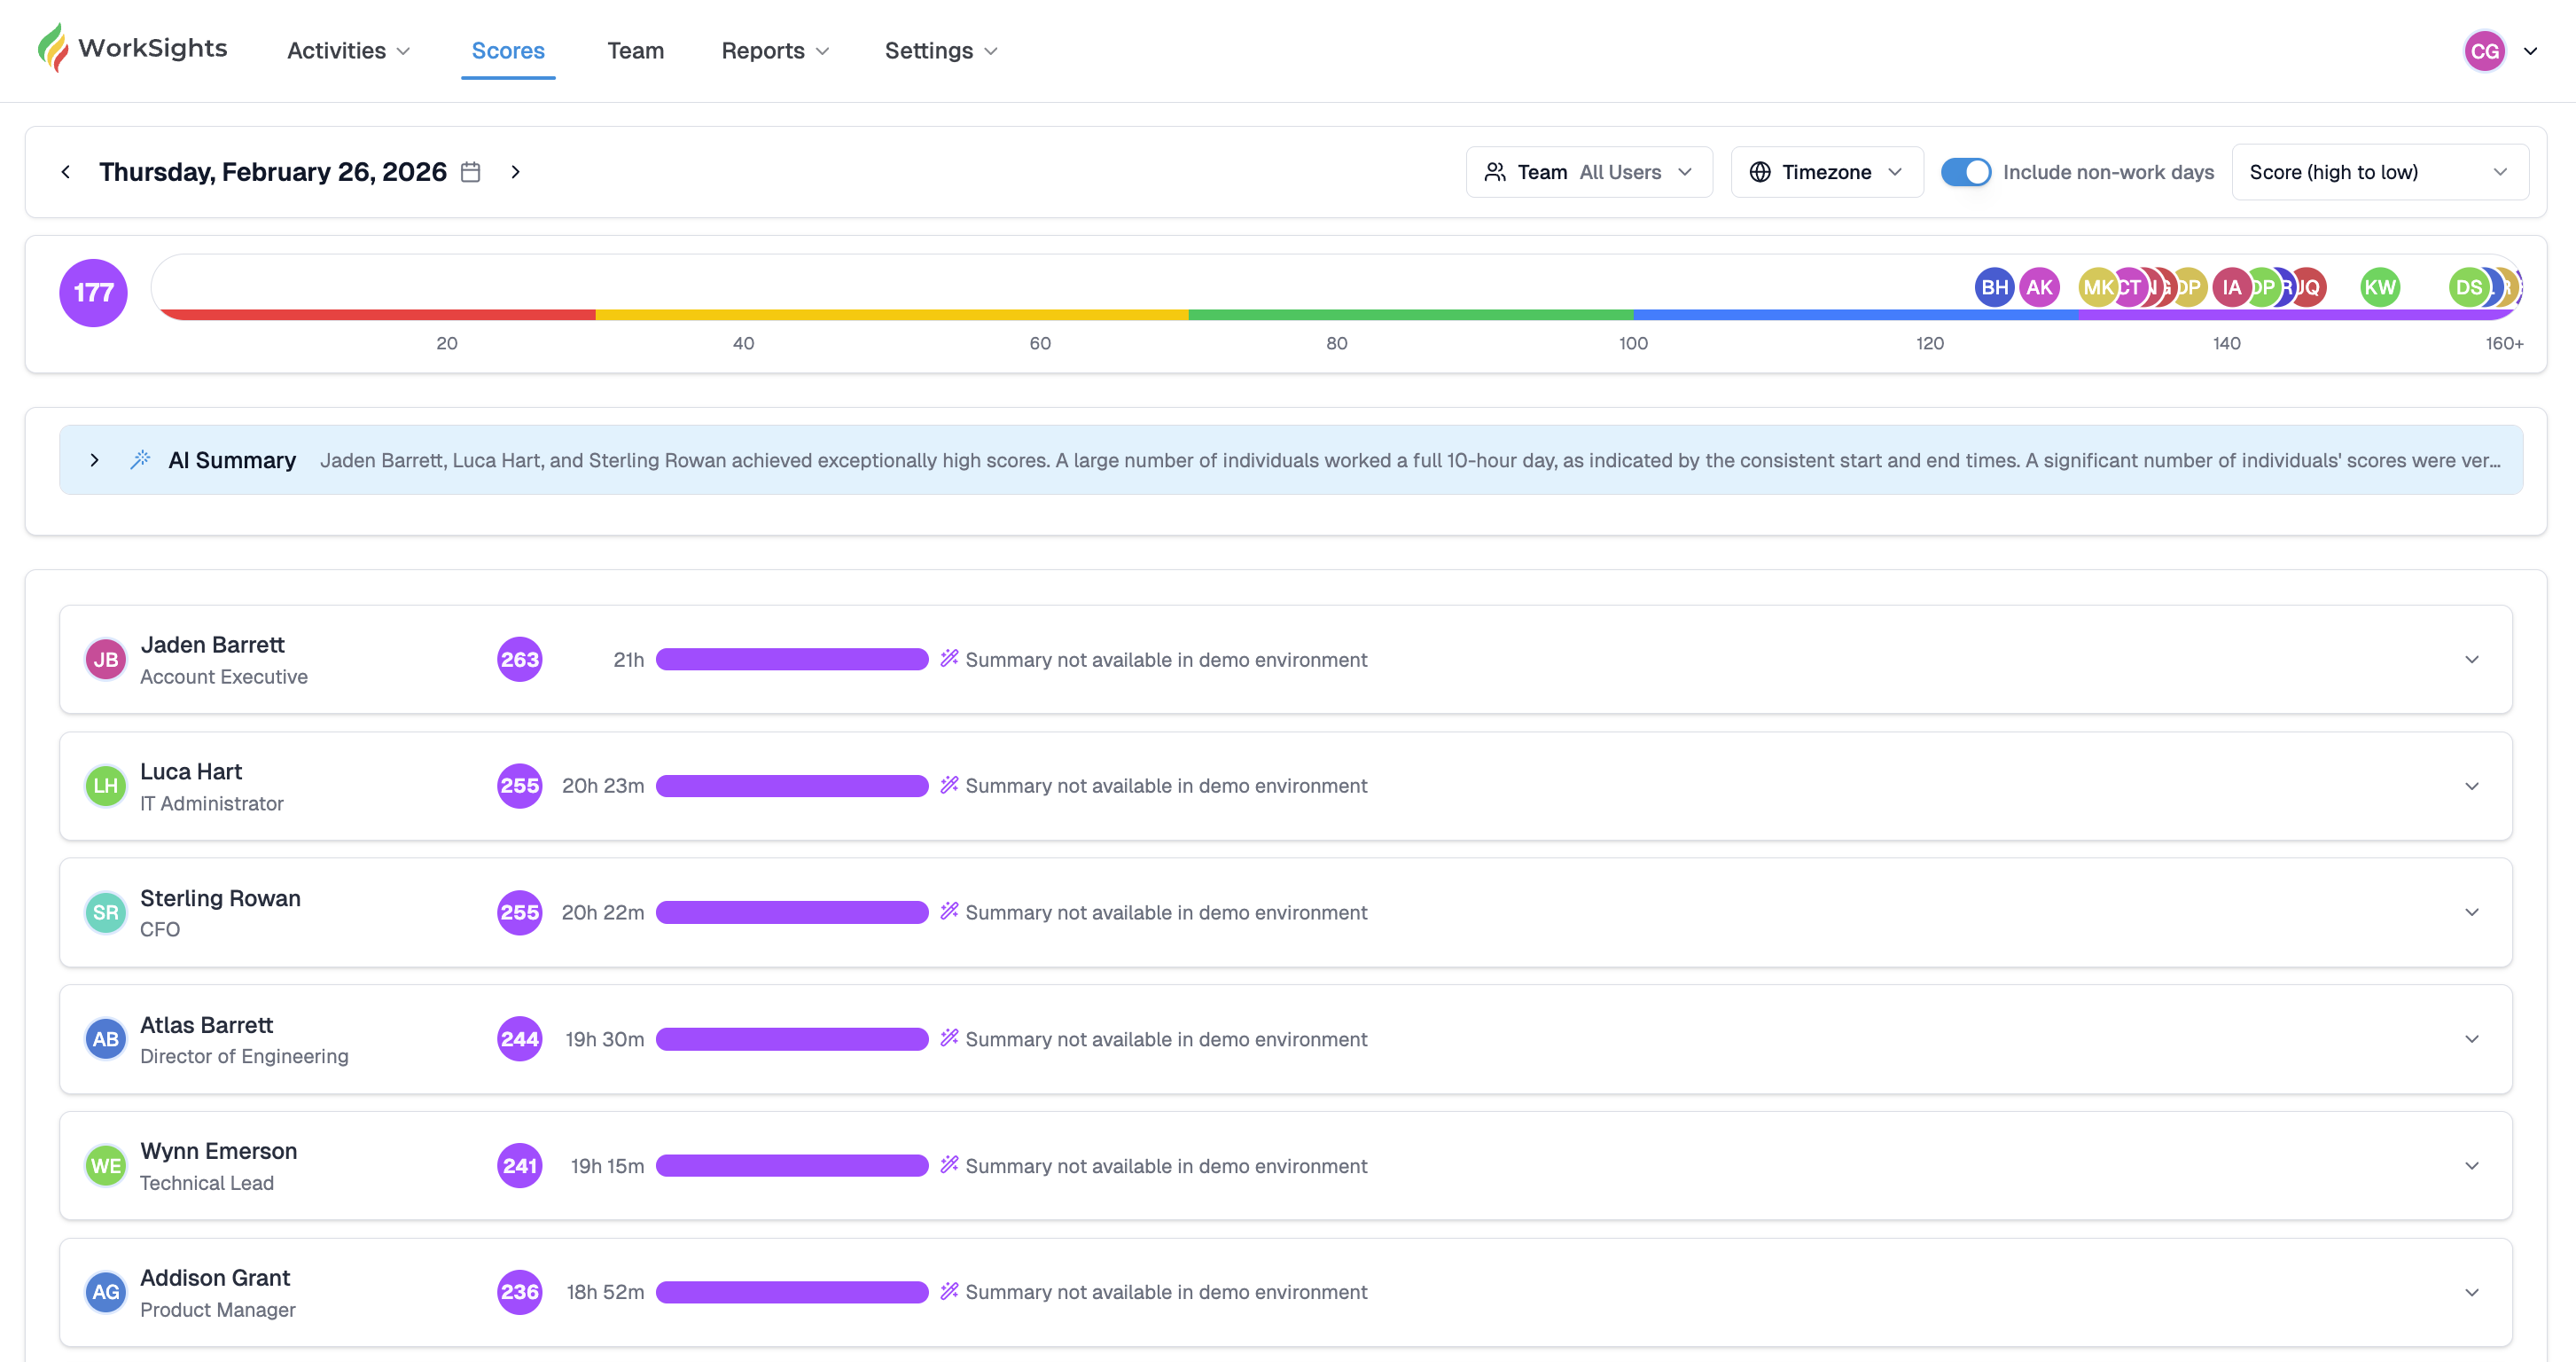
Scores are activity estimates, not performance ratings. They reflect how consistently someone engaged across their connected tools during their working hours. They do not measure output, quality, or effort, and they do not capture anything a person did not already share through the tools your organisation uses every day.
You can reach it from Activities in the top navigation, then select Scores.
Team Score
At the top of the page, the coloured bar shows your Team Score for the selected date. It brings together individual activity estimates into a single picture of how active the organisation was that day.
The bar uses a colour scale to give you a quick read on where the day landed relative to typical activity levels.
- Red - very light activity, or connected services may not have sent data for this period
- Yellow - below typical activity levels but present
- Green - activity in line with a normal working day
- Blue - above typical activity levels, often reflecting extended collaboration or a busy period
- Purple - sustained high activity across the day
Colour thresholds are relative to your organisation's typical patterns, not a universal standard. A green day for one team may look different from another.
AI Summary
Below the Team Score, ClientSights provides an AI-generated summary of notable patterns for the day. This might include people with unusually high or low activity, groups who followed similar working patterns, or significant shifts from the norm such as an unusually early start across the team.
The summary gives you an immediate sense of how the day unfolded without having to read through every individual row.
Individual Scores
Each person's activity estimate appears as its own card showing their name and role, their estimate for the day, total hours represented by their activity signals, a colour indicator, and an AI-generated daily summary where available.
The per-person summary is a short narrative description of how the day looked in aggregate. For example: "Started work around 8:45 AM with early activity in the repository. Exchanged emails with internal and external contacts throughout the morning and continued collaborating on a shared document into the evening."
Summaries describe when someone's active period started and ended, the main clusters of collaboration, and which tools saw the most use. They do not reveal message content, file content, or any personal information beyond what the activity signals themselves contain.
Viewing Options
Several controls let you adjust how you see the day.
- Team / Individuals - switch between the aggregate view and the per-person list
- Timezone - align the view across regions if your team is distributed
- Include non-work days - toggle whether weekends or recognised off-days appear
- Sort - order the list by estimate, name, or role
How Scores Update
Activity estimates refresh automatically once your connected services have finished sending their data for the day. Most services complete this between 1:00 AM and 4:00 AM local time, so estimates for a given date typically reflect the full working day by the following morning.
If an estimate looks unexpectedly low, it is worth checking whether the relevant integrations are connected and sending data correctly before drawing any conclusions.
Reading the Numbers
Activity estimates are a starting point for questions, not a finishing point for conclusions. A green day suggests typical engagement across tools. A blue day often reflects a busy period or extended collaboration. A red day usually means a connected service did not send data, the person was not working, or they are not yet fully set up in ClientSights.
What the numbers do not tell you is why. A quiet day in the tools might mean someone was heads-down in focused work, travelling, unwell, or simply working in ways that your connected services do not capture. Scores are most useful as a prompt for a conversation, not a substitute for one.
Related Guides
Activity Dashboard - day-by-day activity timelines across your team
Activity Detail - a full breakdown of one person's activity on a specific date
Connected Services - checking integration status if estimates look incomplete
Notification Settings - control how ClientSights alerts you to significant patterns