


Table of contents
Activity Report
The Activity Report shows how activity unfolded across your organisation over a selected period. It brings together metadata from your connected services into a time-based chart and a detailed daily breakdown, giving you a clear path from high-level patterns down to individual events.
You can reach it from Reports in the top navigation, then select Activity.
Activity Hours Chart
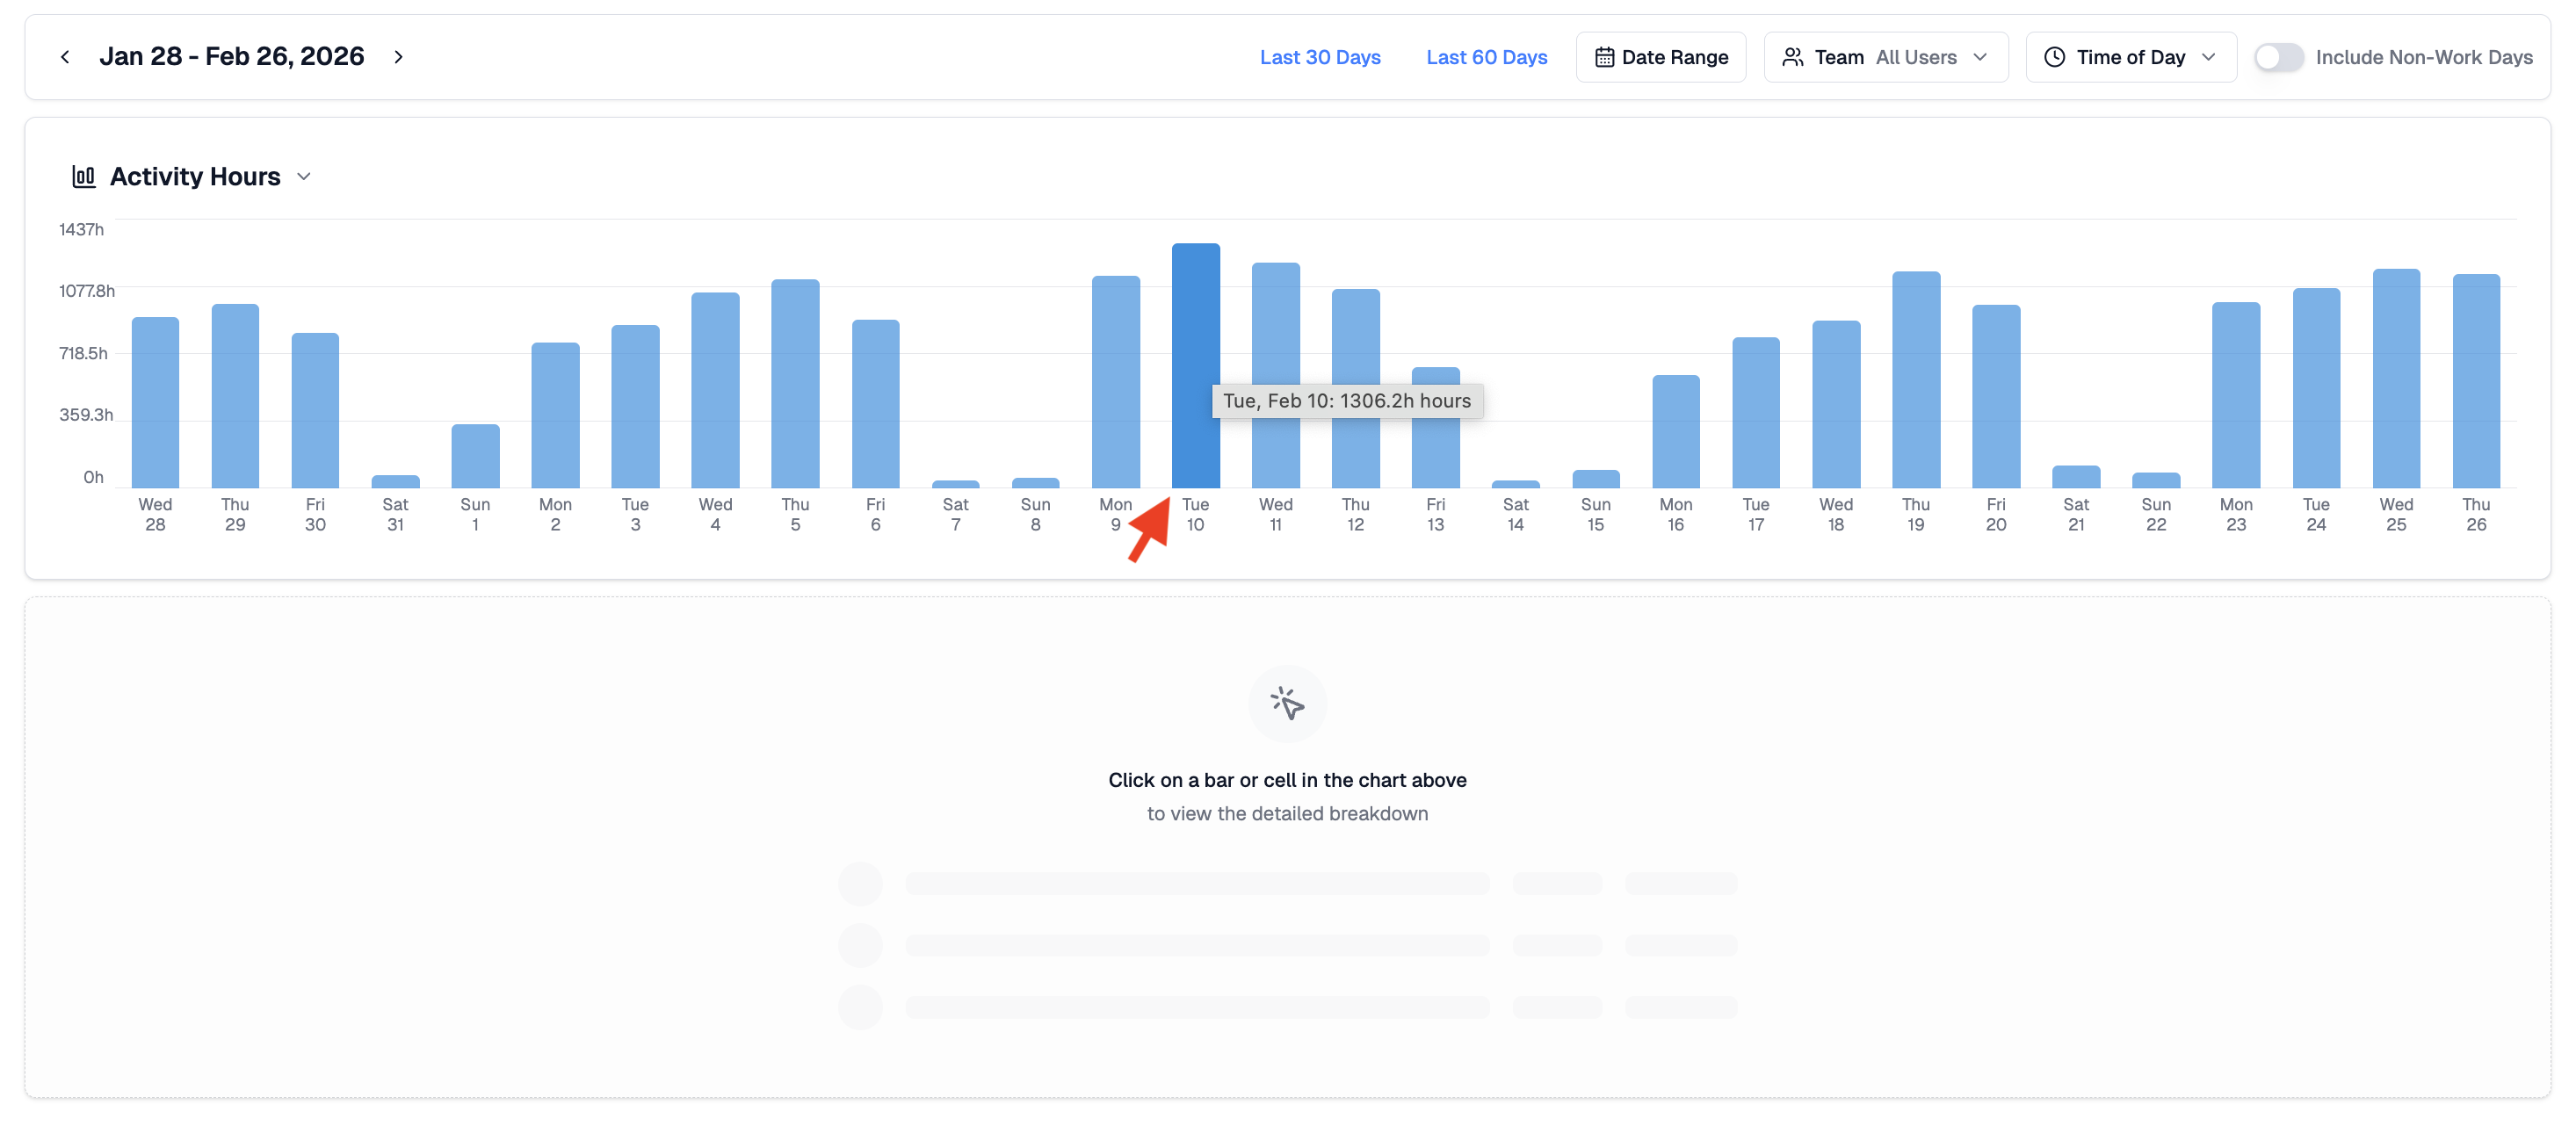
The report opens with a bar chart showing total activity hours per day across your selected date range. Activity hours represent the combined duration of all activity events recorded across your connected services.
Hover over any bar to see the exact total for that day. Use the filters to adjust the date range, narrow to a specific person or group, segment by time of day, or include non-work days. Switch between preset ranges such as Last 30 Days or Last 60 Days, or define a custom window.
The chart is a fast way to spot high-activity periods, unusually quiet days, onboarding gaps, or signs that a connected service may not be sending data.
Daily Breakdown
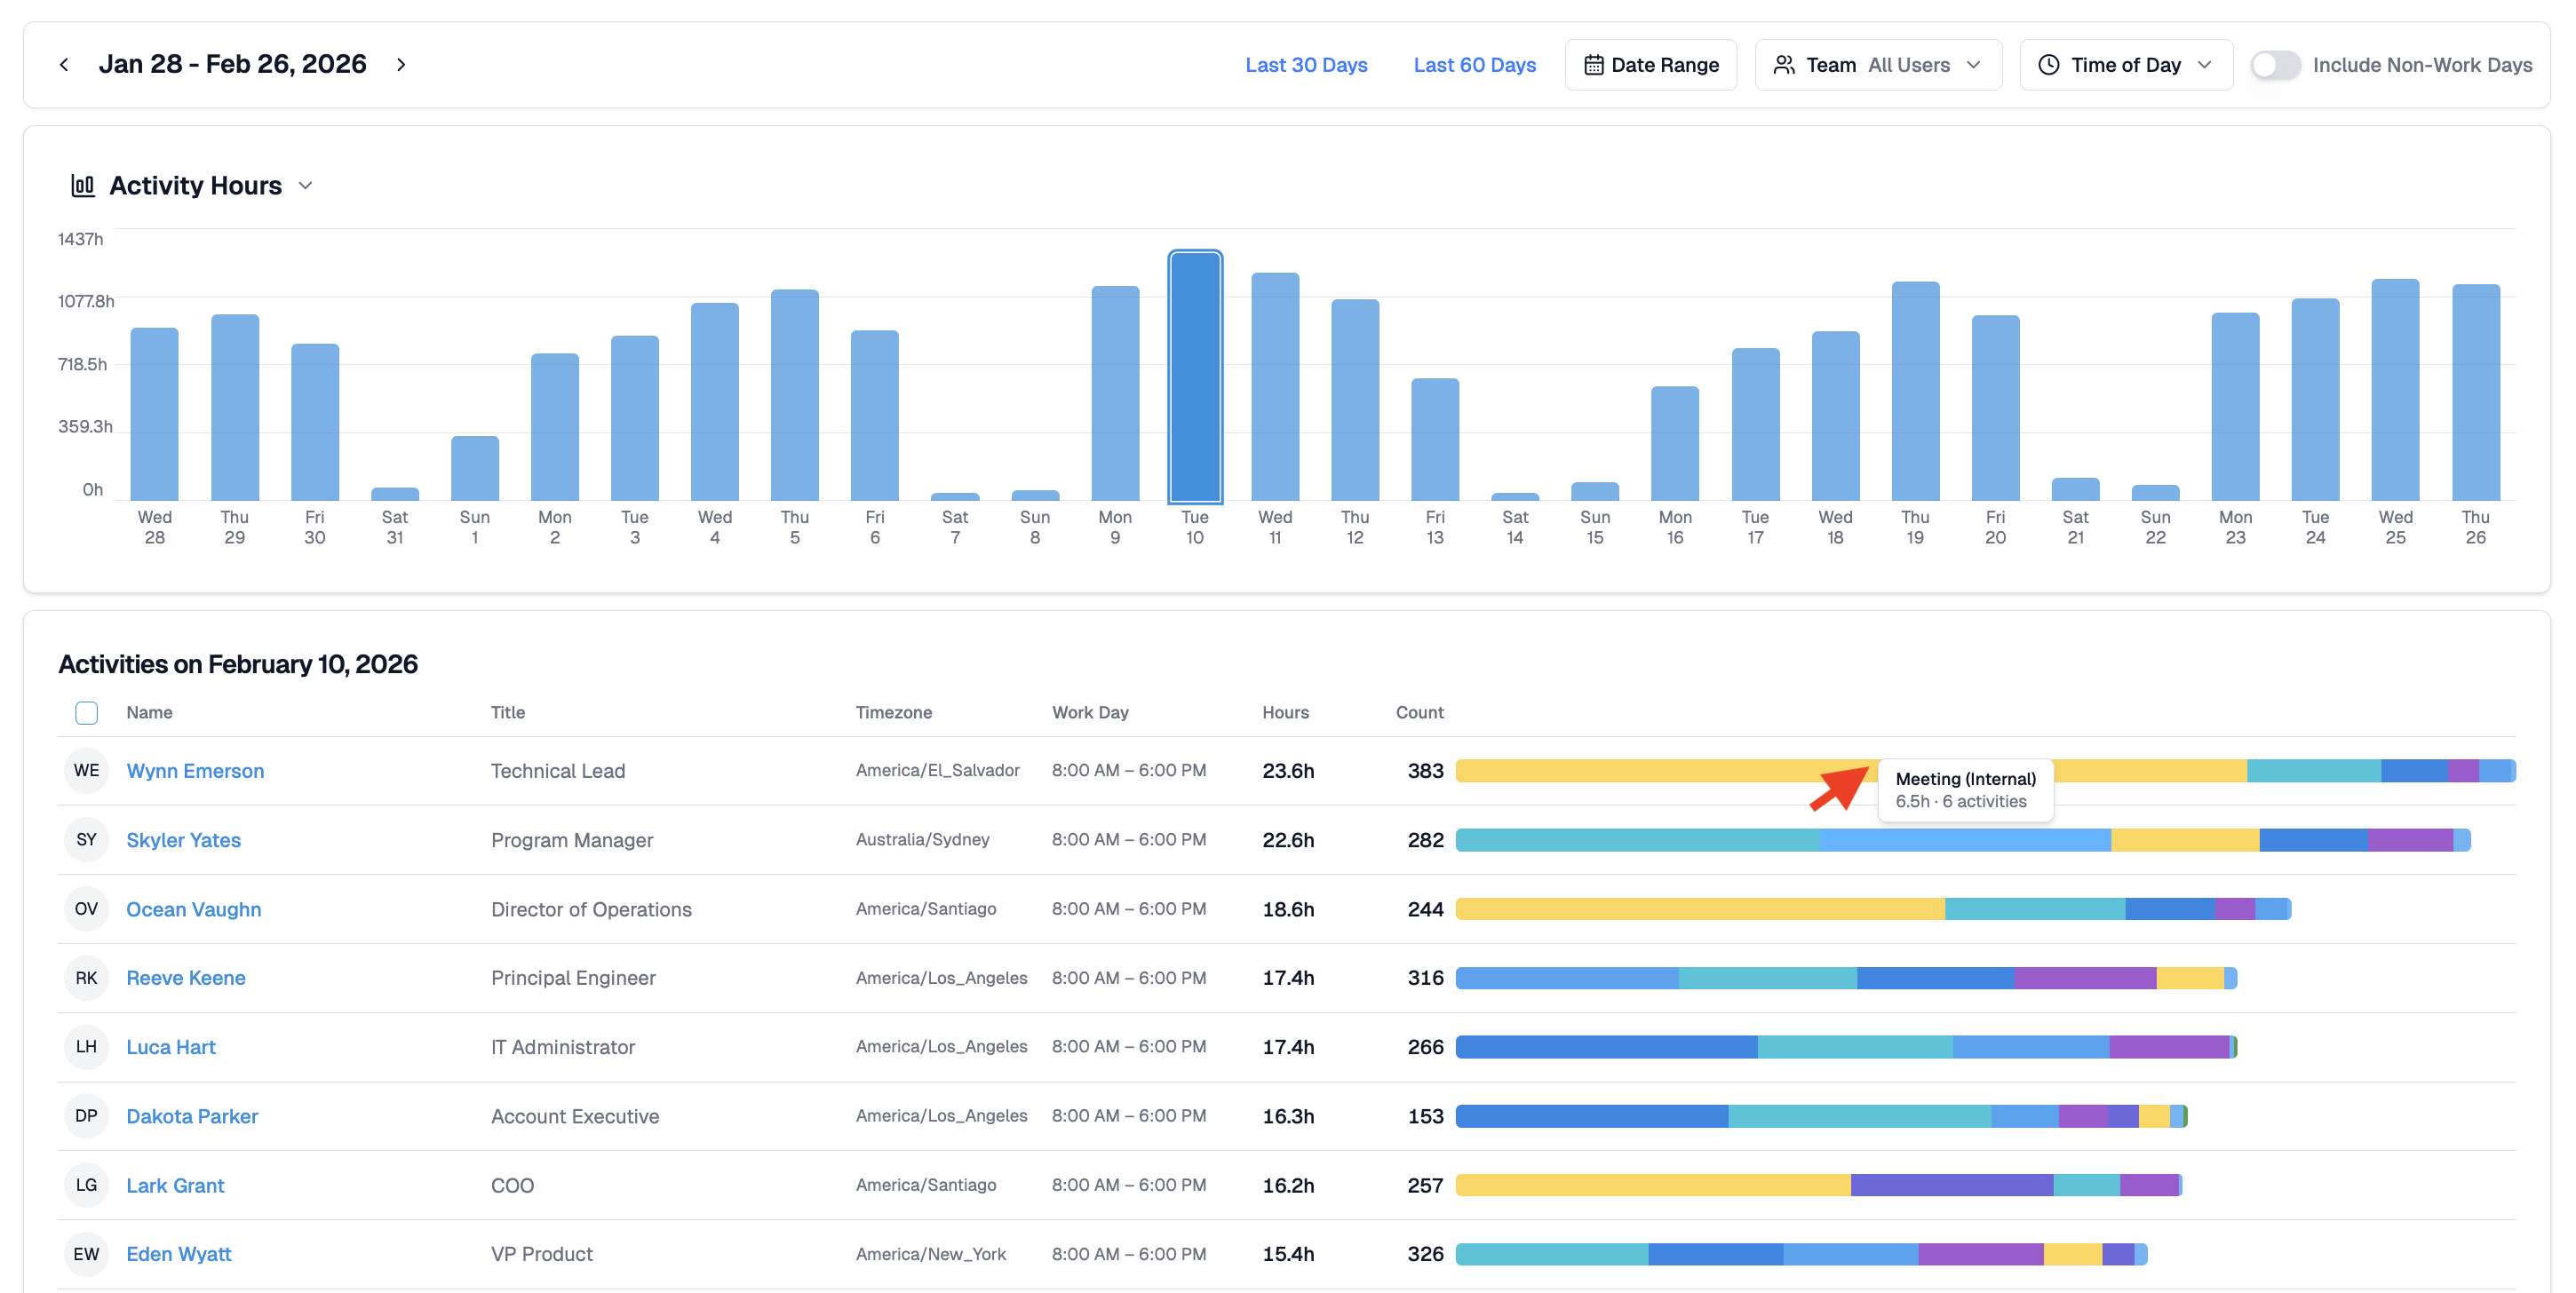
Clicking any bar in the chart loads a detailed table for that specific day. Each row shows the person's name, role, timezone, workday configuration, total activity hours, activity count, and a colour-coded bar showing how their time was distributed across activity types.
Colours represent activity categories such as messaging, files, meetings, presence, and system events. Hovering over any segment shows the category and the underlying duration or count.
This breakdown shows who contributed to the day's overall activity and how their work was spread across tools and services.
Activity Drill Down
Clicking any colour segment in a person's activity bar opens the Activity Detail view, pre-filtered to that person and that activity type. This makes it straightforward to trace a pattern in the chart all the way back to the specific events behind it.

Viewing Options
Several controls let you adjust what the report shows.
- Date range - define the period shown in the chart. Switch between preset ranges or set a custom window.
- Team - limit the report to a specific person or group.
- Time of day - segment activity by working hours.
- Include non-work days - surface weekends or custom off-days for context.
These options do not alter the underlying activity data. They reshape the view for easier interpretation.
Related Guides
Score Report - team activity estimates across a date range
Activity Detail - full breakdown of one person's activity on a specific date
Activity Dashboard - day-by-day activity timelines across your team
Connected Services - checking integration status if activity looks incomplete